set.seed(34567)
x <- runif(10); y <- 4*x+rnorm(10)
fit <- lm(y~x)
r2 <- summary(fit)$r.squared
# plot data and regression line
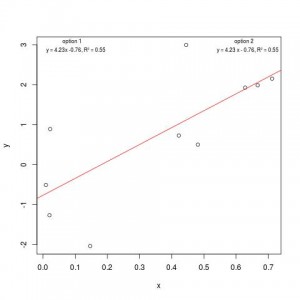
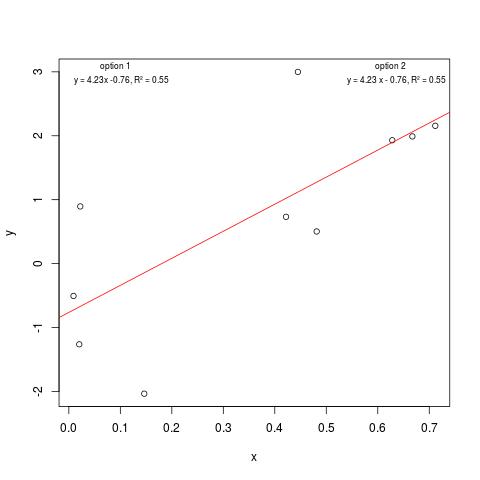
plot(x, y)
abline(fit, col=2)
# add text to plot with legend()
legend('topleft', title='option 1',
legend=sprintf("y = %3.2fx %+3.2f, R\UB2 = %3.2f",
coef(fit)[2],coef(fit)[1], r2), bty='n', cex=0.7)
# if you prefer a space between plus/minus and b
b<-coef(fit)[1]
if(b<0) {b_sign='-'; b=-b} else {b_sign= '+'}
legend('topright', title='option 2',
legend=sprintf("y = %3.2f x %s %3.2f, R\UB2 = %3.2f",
coef(fit)[2],b_sign,b,r2), bty='n',cex=0.7)
Important: R\UB2B2 defined R square symbol. B2 is the hex code for UTF-8 character ² and \U is a control sequence that will call that character.
No comments